
Reports & Analytics
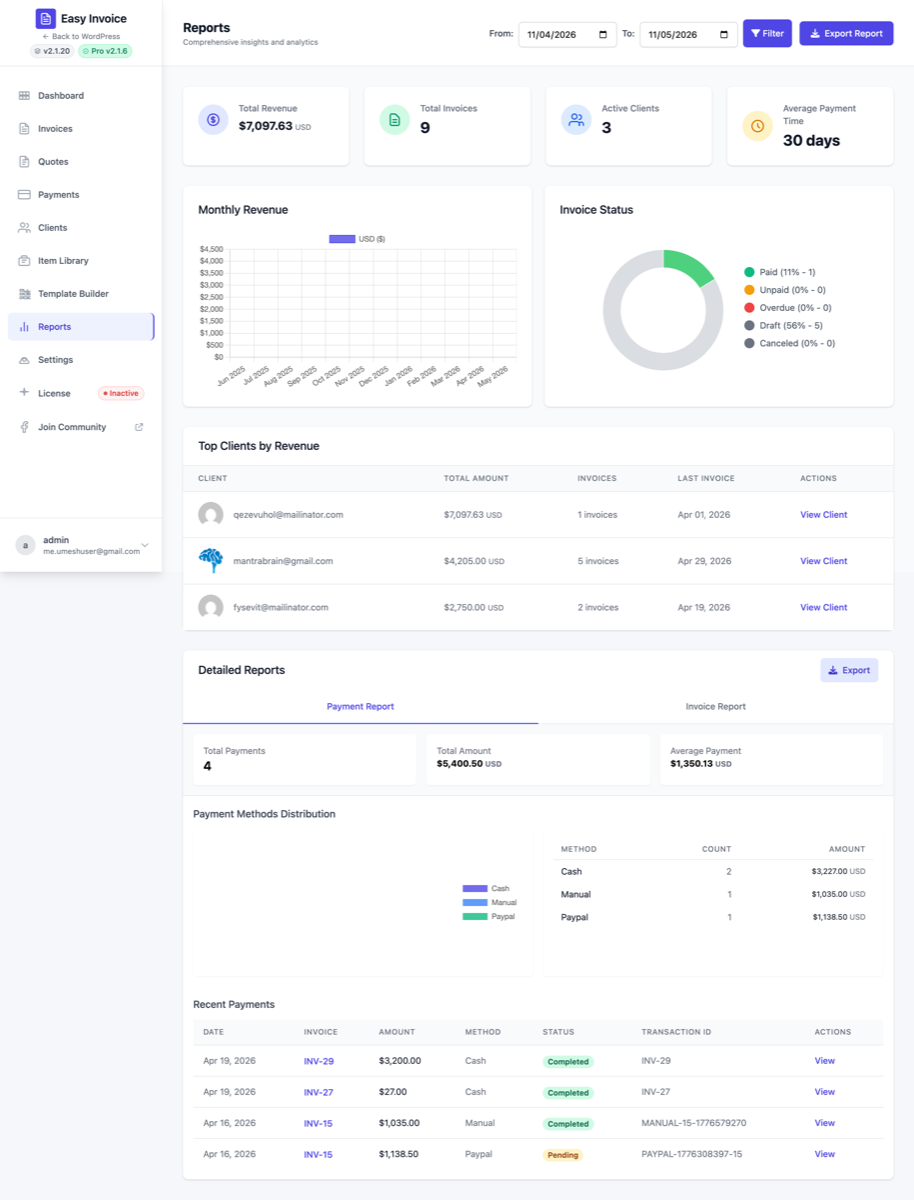
Stop guessing at your business performance. A visual dashboard answering the questions you actually care about: How much did I bill last month? Who hasn't paid? Which clients drive the most revenue? Filter by any date range, export the data for your accountant, and decide on data.
When to use it
- It's the end of a quarter and you want a quick "how did we do?"
- You want to know which clients are your best (and worst) revenue drivers
- You need numbers for a tax return, an investor update, or a loan application
- You suspect overdue invoices are growing but want to see the data, not eyeball the list
Enabling
- Open Easy Invoice → Addons
- Find Reports & Analytics
- Click Activate
A new Reports entry appears in the Easy Invoice in-app sidebar. (On the free plugin this entry shows with a "Pro" upsell badge.)
What's on the dashboard
The Reports page is split into four main visualizations:
Revenue over time
A line / bar chart of your invoiced revenue with selectable date ranges:
- Today
- This week / Last week
- This month / Last month
- This quarter / Last quarter
- This year / Last year
- Custom range — any start and end date
You can switch between Invoiced (everything billed) and Collected (only what's been paid). The collected number is your actual cash; the invoiced number is your top-line revenue.
Outstanding balances
Pie chart breaking down what's still owed by status:
- Overdue (past due date) — usually the urgent bucket
- Pending (due but not overdue)
- Partial — partially paid, balance remaining
Click any slice to drill into the underlying invoices and chase them up.
Per-client performance
A leaderboard of your clients ranked by total invoiced revenue. Filter by date range to see "who were my best clients last quarter?" or "which clients have I never billed?". Each row shows:
- Total invoiced
- Total collected
- Outstanding balance
- Number of invoices
- Average invoice value
Great for client review meetings and prioritizing where to invest your attention.
Payment status mix
Bar chart of invoices by status (Paid / Partial / Pending / Overdue / Draft) across the selected date range. Quickly spot whether collections are healthy or whether overdue is creeping up.
Filters
Every chart shares a single date-range filter at the top of the page. Change it once and every chart updates.
You can also filter by:
- Client (single or multiple)
- Invoice status
- Currency (if you bill in multiple currencies)
- Tag (if you tag clients or invoices)
Profit & loss
Below the charts, a Profit & Loss statement for the date range chosen at the top of the page: money received against money spent, month by month, with net profit and margin.
- Income is every completed payment on the day it arrived (cash basis) — card, PayPal, bank transfer, and retainers when they are received (not again when they are applied).
- Expenses come from the Expense Tracking addon. With it off, the statement is income-only and says so.
- Underneath: income by payment method, expenses by category, and a bar chart of the months.
- Export CSV downloads the statement — one row per month, totals, and the two breakdowns.
The statement is kept to the site currency so the figures add up; payments or expenses in another currency are listed separately below it rather than summed in.
Export
The Export this report button on each chart downloads the underlying data as CSV. Pairs with the Bulk Email & Export addon for cross-dataset exports.
Settings location
Reports has its own admin page (reached via the Easy Invoice sidebar). No separate settings — the page IS the report.
See also
- Bulk Email & Export — for raw CSV exports across all data
- Smart Reminders & Late Fees (Professional) — to auto-recover the overdue balances Reports highlights